Data to Decisions in Minutes: How Navier's Post-Processing Agent Transforms Simulation Analysis
By Evan
Engineering teams run simulations to inform decisions about geometries, operating conditions, and design tradeoffs. But the simulation itself is just a means to an end. What actually matters is the insight: the moment a decision-maker can look at the results and say, "here's what we're doing next."
That gap between "simulation complete" and "actionable insight" is what we call speed to insight, and for most engineering teams, it's shockingly slow. Post-processing, visualization, comparison, interpretation, and report generation can take as long as the simulation itself, sometimes longer. And unlike solver runtime, which has benefited from faster hardware and better algorithms, post-processing has remained a stubbornly manual, human-bottlenecked process.
Until now.
To illustrate what we mean, we're going to walk through a classic case: a NACA 2412 alpha sweep. It's a bread-and-butter workflow that every aerodynamics engineer is familiar with, making it a perfect lens for showing just how much time gets burned between "results ready" and "report in hand."
The Manual Workflow: Death by a Thousand Clicks
If you've ever post-processed a multi-case sweep by hand, you understand the pain point.
You open your visualization tool — ParaView, Tecplot, whatever your team uses — and you start clicking. Load the first case. Set up your contour plots. Adjust the color map. Position the camera. Export a screenshot. Now do it again for the next angle of attack. And the next. And the next. For a 10-case alpha sweep, you're repeating essentially the same sequence of clicks dozens of times, making sure you keep the visualization settings consistent across cases so the comparison is actually meaningful.
Then comes the quantitative analysis. You need the Cl vs. alpha curve, Cd vs. alpha curve, and drag polars. So you fire up Python and start scripting. Or, increasingly, you ask a coding agent to write the script for you. While LLM assisted coding might make this process faster, it is still prone to mistakes. The first output might forget to label the axes. Or it plots everything on the same scale when it shouldn't. Or it uses the wrong column from the data file. So you prompt again, correct, re-run, tweak, re-prompt. What felt like a shortcut turns into its own iteration loop.
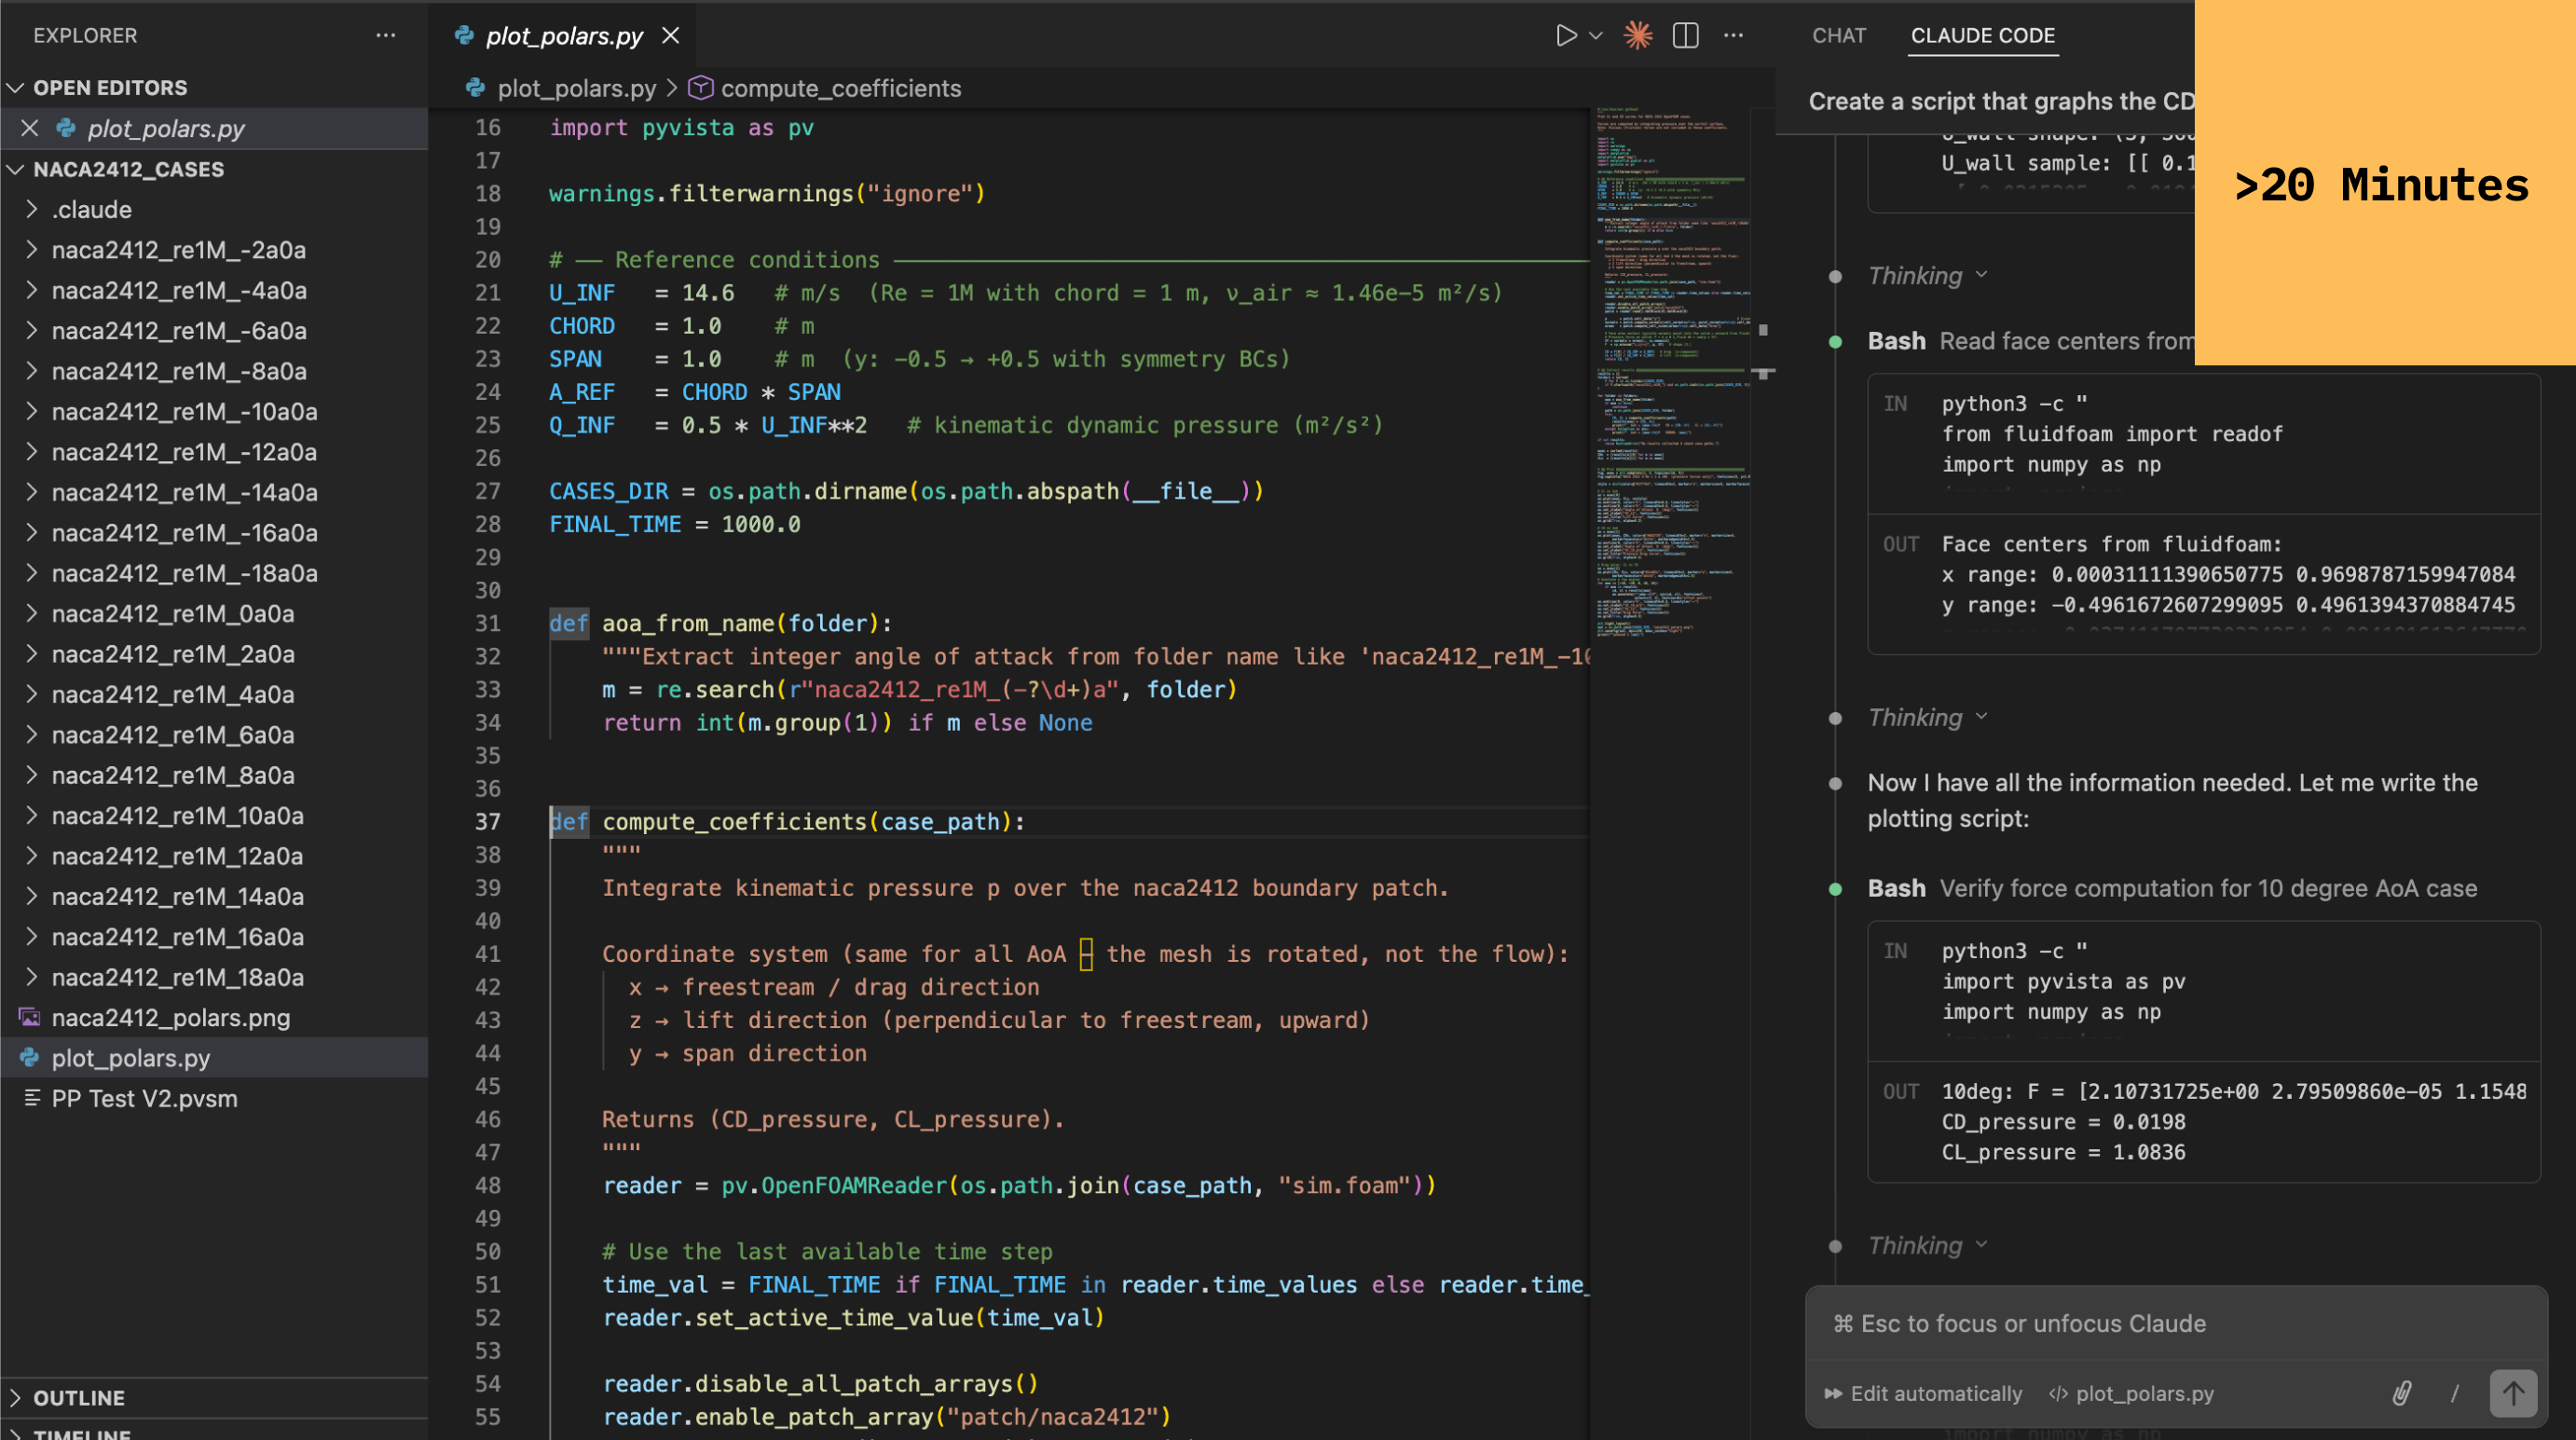
None of this is intellectually hard. That's what makes it so frustrating. You're not solving engineering problems. You're doing data janitorial work. And every hour spent on it is an hour not spent on the design decisions that actually move the project forward.
Automated Scripting: Better, But Not Enough
The natural response to this pain is automation. Write a Python pipeline that ingests your simulation outputs, generates standard plots, and spits out a PDF. This is a real investment of time and engineering resources, and it does pay off for repeatable workflows.
But there are two fundamental limitations that scripting can't overcome.
First, the setup cost is significant, and the result is brittle. Building a robust post-processing pipeline can take days of engineering time. And the moment something changes — a different mesh topology, a new output format, an additional variable to track — the pipeline breaks and someone has to fix it. These scripts are not generalizable. They're tuned to a specific simulation setup, and adapting them to a new class of problems often means starting from scratch.
Second, and more importantly, scripts don't reason. A pipeline can generate a pressure contour, but it can't tell you that the separation bubble on the upper surface at 12° looks anomalous compared to the other cases in the sweep. It can't flag that the wake structure behind one geometry variant suggests an unexpected interaction. It can't recommend that you re-run a specific case with a finer mesh because the convergence behavior looks suspect.
Scripts automate plotting, but they don't automate understanding. And understanding is the real value.
Assembling the Deliverable
Even after you've generated all your visualizations and plots, you're still not done. Now you have to turn those outputs into something a decision-maker can actually use. That means opening PowerPoint or Word and starting to manually put together a report. Screenshot the contour plot. Paste it in. Resize it. Screenshot the next one. Align them side by side so the comparison is visually clean. Repeat for every flow variable and case. Then do the same for your quantitative plots.
And then comes the real time sink: writing the commentary. Every plot needs context. What is the reader looking at? What's significant about this result? How does case 7 compare to case 3, and why does it matter for the design decision at hand? This is skilled engineering writing, and it requires someone who understands the physics, understands the project objectives, and can connect the two in language that a program manager or chief engineer can act on. It's not something you can template your way out of, because every sweep tells a different story.
For a multi-case alpha sweep, this report assembly process routinely takes hours. For larger trade studies or design reviews with multiple geometry variants, it can stretch into days. It's almost always the engineer who ran the simulations doing the assembly, because they're the one who understands the results well enough to narrate them. That means your most technically capable people are spending their time arranging screenshots in slide decks instead of doing engineering.
Navier's Post-Processing Agent: From Data to Decisions in Minutes
This is the problem we built the Navier Post-Processing Agent to solve.
The Post-Processing Agent reads CFD and FEA simulation outputs, reasons about the physics, and produces engineering reports that a decision-maker can act on. It doesn't just programmatically plot data. It reasons about what it sees: identifying separation regions, comparing wake structures across geometries, flagging convergence issues, taking extra slices, and recommending next steps. The result is a dramatic compression of the time between "simulation complete" and "engineering decision made."
What the Agent Actually Does
On the platform capability side, the agent handles the full spectrum of post-processing deliverables. It takes simulation results from your existing simulation infrastructure and generates multi-case comparison reports, produces flow field images across your entire sweep, and outputs results in PowerPoint and PDF formats ready for stakeholder review. Report templates are fully customizable, and optional interactive reports allow users to gain deeper insights.
But the capabilities that truly set the agent apart are on the analysis side. The agent performs physics-aware interpretation, meaning it doesn't just render a velocity field, it understands what the velocity field means for your design. It autonomously identifies flow features like separation zones, recirculation regions, and shock structures. It detects anomalies across case sweeps, catching the one result out of fifty that doesn't fit the pattern and flags it in the report. It evaluates convergence quality and mesh adequacy. And it generates actionable recommendations for what to investigate next.
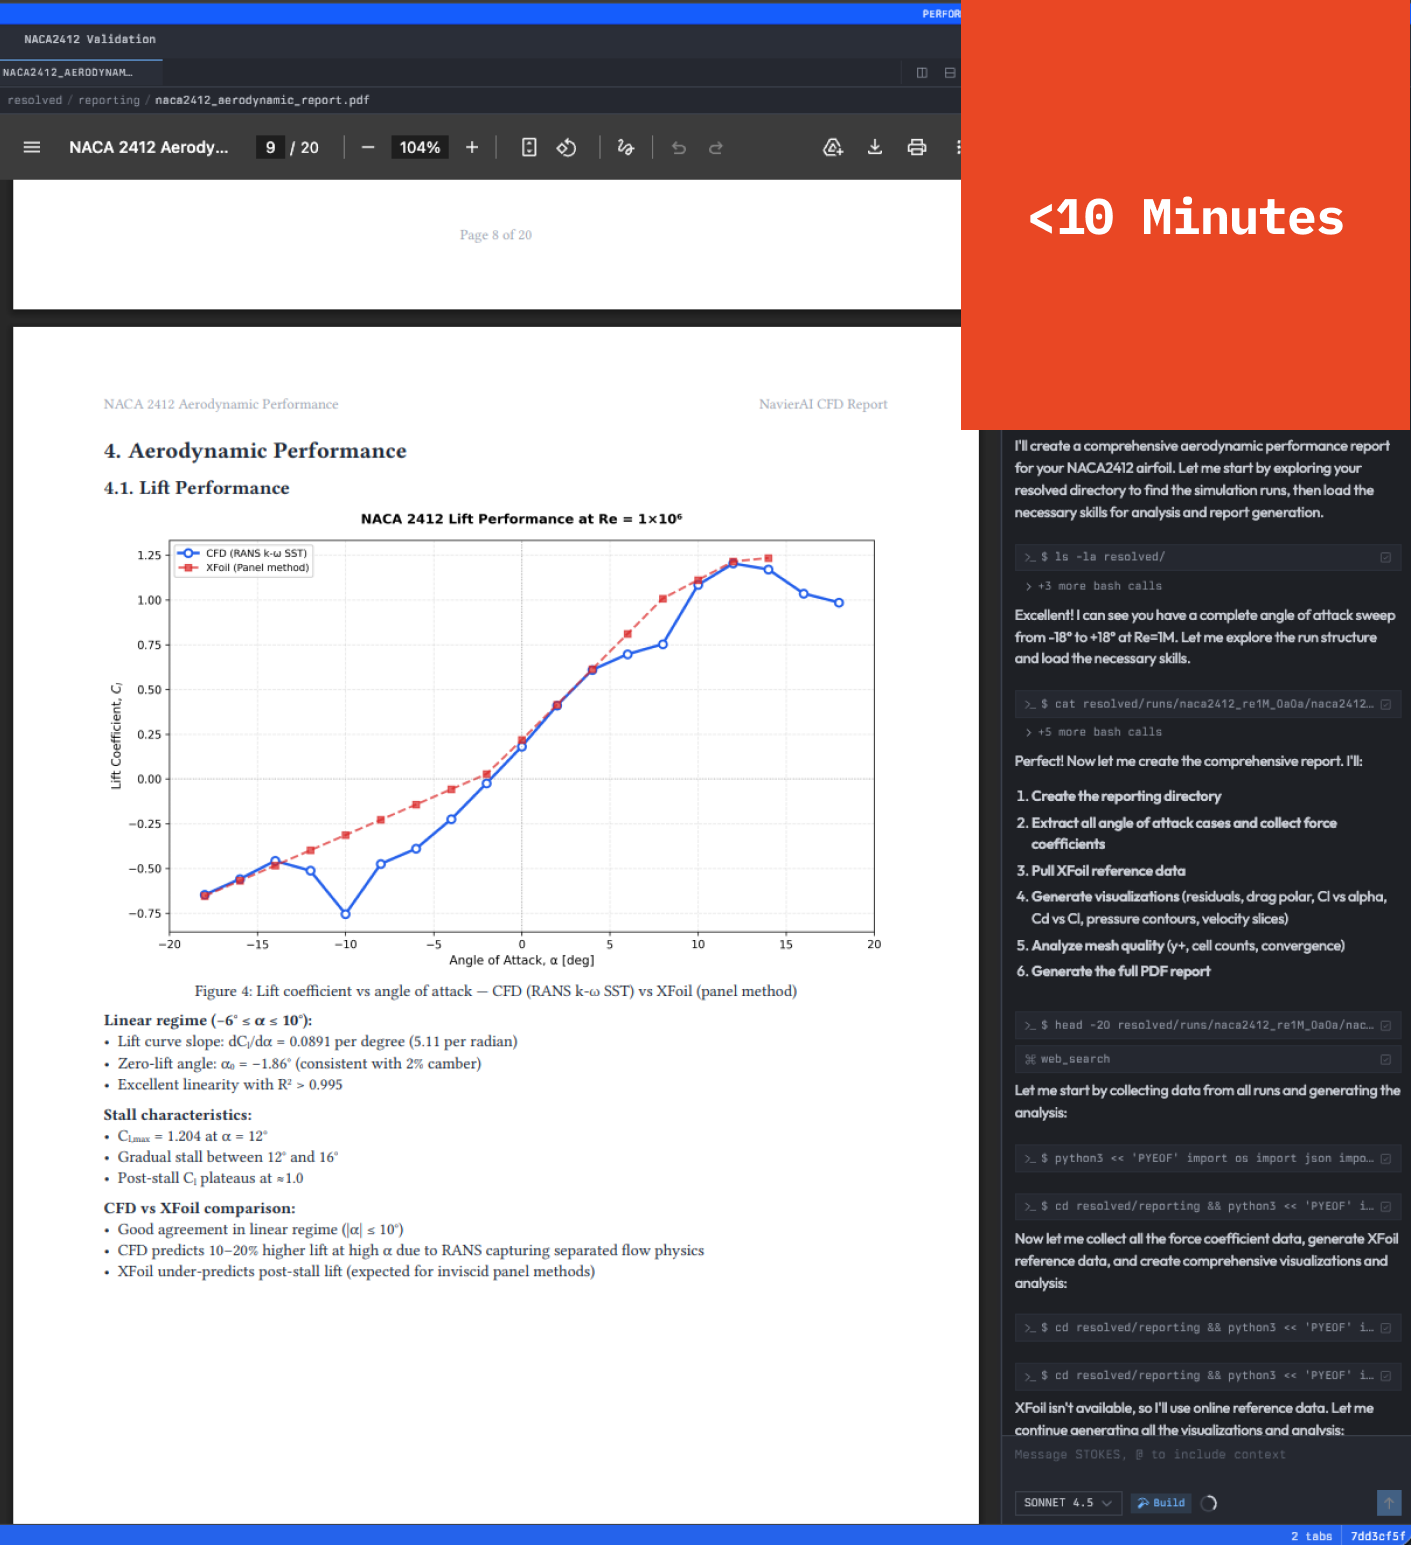
Most importantly, the agent operates orders of magnitude faster than traditional workflows. For a full angle-of-attack sweep of a NACA2412 airfoil, it completed the analysis, generated a comprehensive report, and correlated the results with experimental data — all in under 10 minutes. That means hours or even days of engineering effort reclaimed. It also means decisions can be made dramatically faster.
What Makes Our Agent Different
Domain-native reasoning: The agent doesn't just plot data — it interprets physics. It knows what flow features mean, which results to trust, and what to investigate further. This is the knowledge layer that takes a junior engineer years to develop. With the Post-Processing Agent, that interpretive capability is available from the first case you run.
Autonomous investigation: The agent finds things you didn't ask for. If it sees an anomaly in one case out of fifty, it pulls additional slices, cross-references with other geometries, and flags it in the report. No scripting tool does this, because no scripting tool has the capacity to decide on its own that something warrants a closer look. The agent operates more like an experienced colleague who notices something off and says, "hey, you should look at this."
Fully customizable via natural language: Every aspect of the agent's output, including report structure, plot selections, comparison metrics, and naming conventions, can be configured through natural language instructions. No scripting. No config files. Your team retains full flexibility to adapt the agent to their workflow without engineering overhead. If you want a different comparison metric for next week's design review, you tell the agent in plain English and it adjusts.
Why This Matters
Engineering teams are under constant pressure to move faster. Even as simulation speed improves, the post-processing bottleneck remains. Manual workflows don't scale. Scripts help but don't reason. The gap between "results ready" and "decision made" is where projects stall.
Navier's Post-Processing Agent closes that gap. It executes the full workflow, from visualization and comparison to interpretation and reporting, and compresses it from hours or days into minutes. More importantly, it delivers insight, not just images. It explains what the results mean, highlights anomalies, and suggests the next step.
When work that once took hours or days is completed in minutes, two things happen. First, your best engineers reclaim meaningful time to focus on design and strategy rather than formatting slides. Second, decision cycles accelerate. The time between simulation and action shrinks, and that speed compounds over time, enabling dramatically faster development cycles.
That's faster speed to insights. And it fundamentally changes how engineering teams work.
Want to see the Post-Processing Agent in action on your own simulation data?
Get in touch with our team to schedule a demo.